

How to Use Heat Maps to Build a User-Friendly Website That Actually Converts (Easy Guide)
- Owen Measures

- Jan 20
- 5 min read
Ever wondered what your website visitors are actually doing when they land on your pages? Where they click, how far they scroll, what catches their eye, and what they completely ignore?
You're not alone. Most UK business owners build their websites based on gut feeling or what looks nice. But here's the thing: what you think works and what actually works can be two very different things.
That's where heat maps come in. They're like X-ray vision for your website, showing you exactly how real people interact with your pages. No guesswork. No assumptions. Just clear, visual data you can actually use.
Let's break it down.
What Exactly Is a Heat Map?
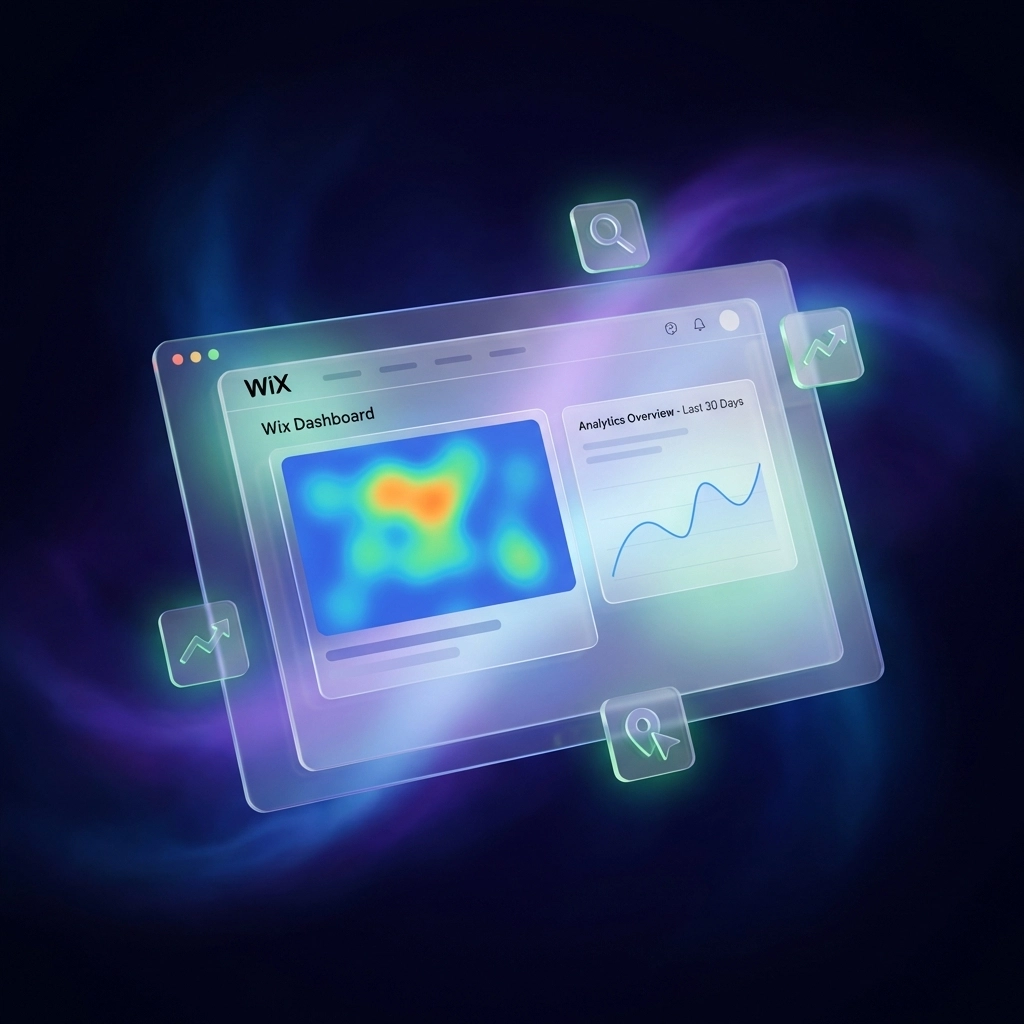
A heat map is a visual tool that tracks where visitors click, scroll, and move their mouse on your website. It uses colours to show you what's hot (getting lots of attention) and what's cold (being ignored).
Think of it like a thermal camera for your website. Red and orange areas mean high activity, people are engaging there. Blue and green areas? Not so much.

The beauty of heat maps is their simplicity. You don't need a degree in data science to understand them. One glance tells you whether your "Buy Now" button is getting clicks or collecting digital dust.
The Three Types of Heat Maps You Need to Know
Not all heat maps are created equal. Each type shows you something different about how visitors use your site.
Click Maps
These show exactly where people click on your page. You'll see if visitors are hitting your call-to-action buttons, clicking on images (even non-clickable ones), or tapping on your navigation menu.
Click maps are brilliant for spotting problems like:
Buttons that nobody notices
Images people try to click but can't
Links that are getting ignored
Scroll Maps
Scroll maps reveal how far down the page people actually go. You might have incredible content at the bottom of your homepage, but if 80% of visitors never scroll past the first section, they'll never see it.
This is especially useful for longer pages, blog posts, and product descriptions. If your most important information sits below the "fold" (the part of the page visible without scrolling), you might need to rethink your layout.
Move Maps (or Mouse Movement Maps)
These track where visitors move their cursor as they browse. While not as precise as click maps, they give you a rough idea of what's catching people's attention.
Move maps are helpful for understanding reading patterns and seeing which sections draw the eye naturally.

Why Heat Maps Matter More Than Ever in 2026
Here's a stat that might surprise you: businesses using heat maps as part of their optimisation strategy see an average 20% increase in conversion rates. That's not pocket change, that's real money.
In 2026, user experience isn't optional. Your competitors are paying attention to how visitors behave on their sites. If you're not, you're falling behind.
Heat maps help you:
Stop guessing and start knowing. You can debate all day about whether a green or orange button converts better. Or you can install a heat map and find out within a week.
Find problems you didn't know existed. Maybe visitors are clicking on an image thinking it's a link. Maybe they're ignoring your carefully crafted headline. Heat maps expose these hidden issues.
Make smarter design decisions. Every change to your website should be based on evidence, not opinion. Heat maps give you that evidence.
If you're working on creating a user-friendly website, heat maps are one of the fastest ways to identify what's working and what needs fixing.
How to Set Up Heat Maps on Your Wix Website
Good news: adding heat maps to a Wix site is straightforward. You don't need to touch any code.
Step 1: Choose Your Tool
Several heat map tools integrate nicely with Wix. Popular options include Hotjar, Crazy Egg, and Microsoft Clarity (which is free). Each has slightly different features, but they all do the basics well.
Step 2: Create an Account and Get Your Tracking Code
Sign up for your chosen tool. They'll give you a small piece of tracking code to add to your website.
Step 3: Add the Code to Wix
In your Wix dashboard, go to Settings > Custom Code. Paste your tracking code in the "Head" section. Save and publish your site.
Step 4: Select Which Pages to Track
Start with your most important pages, your homepage, main service page, and any page where you want visitors to take action (like booking a call or making a purchase). There's no point tracking every single page at first. Focus on what matters.
Step 5: Let the Data Collect
Give it at least a week or two to gather meaningful data. The more traffic you have, the faster you'll get useful insights.
How to Read Your Heat Map Results (Without Getting Overwhelmed)
Right, you've got your heat maps running. Now what?
Here's a simple framework for making sense of what you see:
Look for Hot Zones First
Where are the reds and oranges? These are your high-engagement areas. Check if they align with what you actually want visitors to click. If your "Contact Us" button is glowing red, brilliant. If a random image is getting all the attention while your call-to-action sits cold, that's a problem.
Check Your Scroll Depth
What percentage of visitors make it to the bottom of your page? If you've got essential information or a call-to-action near the bottom, but most people never scroll that far, consider moving it up.
A good rule of thumb: anything critical should appear within the first 50% of scroll depth.
Spot the Cold Zones
Blue and green areas are being ignored. Ask yourself: is there something important in these zones that should be getting more attention? Sometimes a simple design tweak: like adding white space, changing a colour, or adjusting placement: can warm up a cold area.
Watch for False Clicks
People often click on things that aren't clickable: images, headlines, or icons they expect to do something. If you notice this pattern, consider making those elements interactive or adding visual cues that clarify what's clickable.
What to Do With Your Heat Map Insights
Data is useless if you don't act on it. Here's how to turn your heat map findings into real improvements:
Reposition underperforming buttons. If your main call-to-action is getting ignored, try moving it higher on the page or making it more visually prominent.
Simplify cluttered sections. Heat maps often reveal when a page has too much going on. If engagement is spread thin across too many elements, consider stripping back the design. Sometimes minimalist approaches outperform busy layouts.
Move important content above the fold. If scroll maps show visitors aren't reaching your best content, restructure your page so the good stuff appears earlier.
Fix confusing elements. If people keep clicking on non-clickable images, either make them links or redesign them so they don't look interactive.
Test one change at a time. Don't overhaul everything at once. Make one change, let the heat map run again, and see if engagement improves. This way you'll know exactly what worked.
Keep It Simple, Keep It Consistent
Heat maps aren't a one-and-done thing. Your website evolves, your visitors change, and what works today might not work in six months.
Set a reminder to check your heat maps regularly: monthly is a good rhythm for most small businesses. Look for patterns, make small adjustments, and track the results.
Over time, these incremental improvements add up. A 5% conversion boost here, a 10% increase there: suddenly your website is working significantly harder for your business.
Need a Hand With Your Website?
Heat maps can tell you what's happening on your site. But knowing what to do about it: and actually implementing smart changes: is another skill entirely.
At WebOws Design, we help UK businesses build websites that don't just look good but genuinely convert. Whether you need help interpreting your heat map data, redesigning key pages, or building a site from scratch with conversion in mind, we're here to help.
Get in touch and let's chat about making your website work harder for you.
Comments